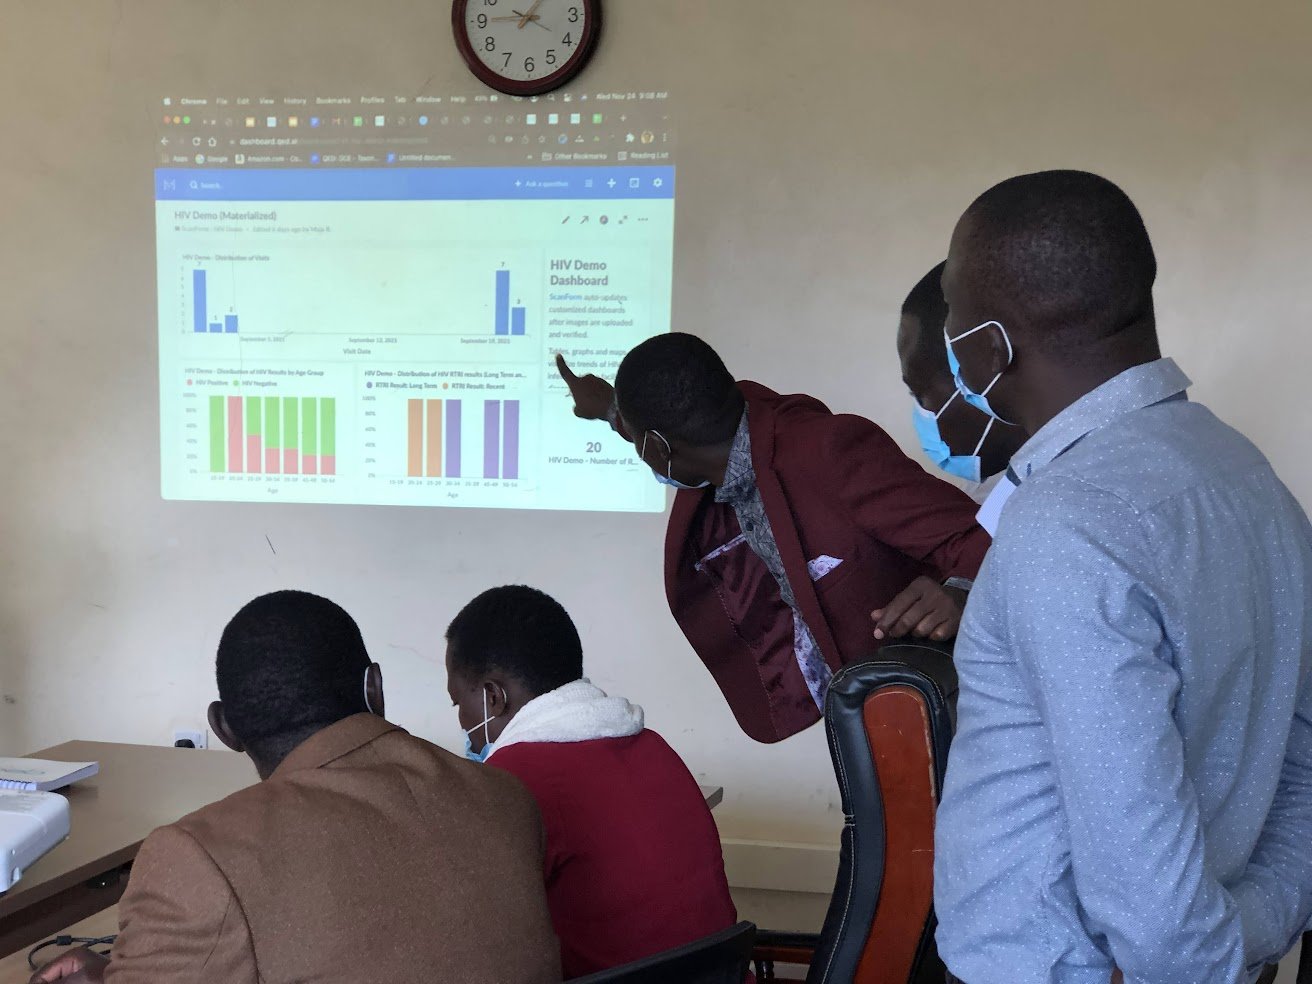
Analytics
ScanForm generates timely analytics by eliminating manual data entry and auto-calculating summaries from patient-level data
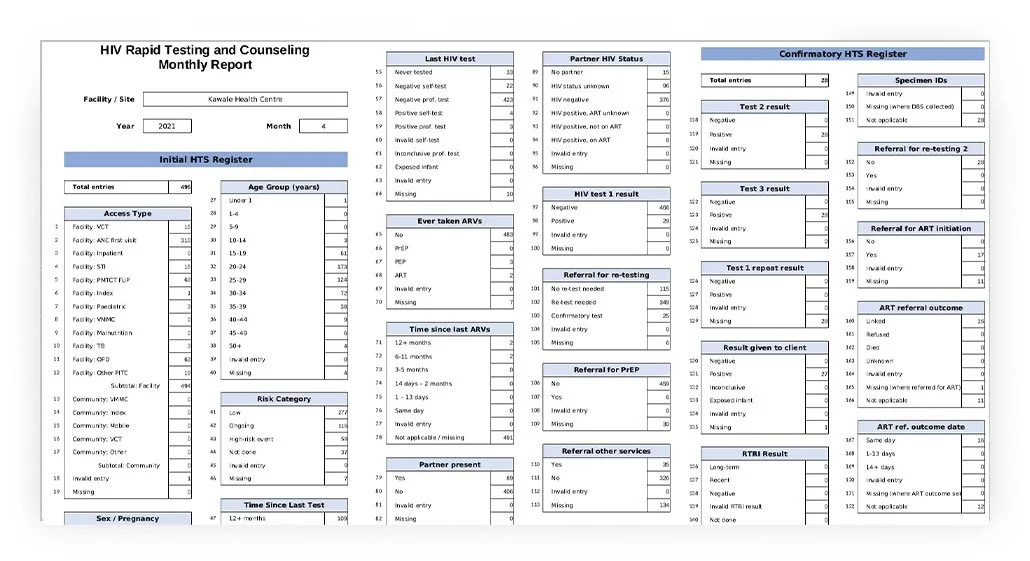
Summary Statistics
ScanForm improves data quality because human calculation errors are eliminated.
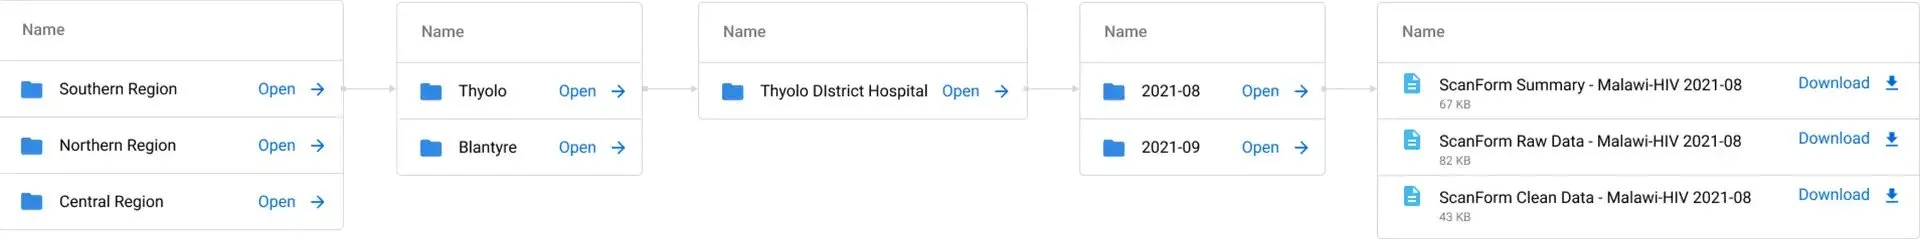
ScanForm auto-generates XLS and CSV files of data on a daily basis, including data quality reports
MOH-compliant summary reports are auto-calculated by the 2nd of each month
All spreadsheets available in a custom data portal
Real World Examples of Data Visualizations
National Scale HTS in Malawi
In Malawi, three scannable MOH registers with ScanForm have been scaled nationally since 2022 to capture data for all HIV testing services (HTS). Since then, ScanForm has expanded to programs including the full HTS cascade, STI, OPD and supply chain.
External donor reporting requirements include HTS data finely disaggregated by 19 testing modalities, 13 age groups, sex, and summary results with over 800 data elements for each monthly facility report (Source: PEPFAR Monitoring, Evaluation and Reporting v2.6). It is impractical to manually abstract all this data from paper registers. With ScanForm, summaries are auto-calculated with a smartphone picture.
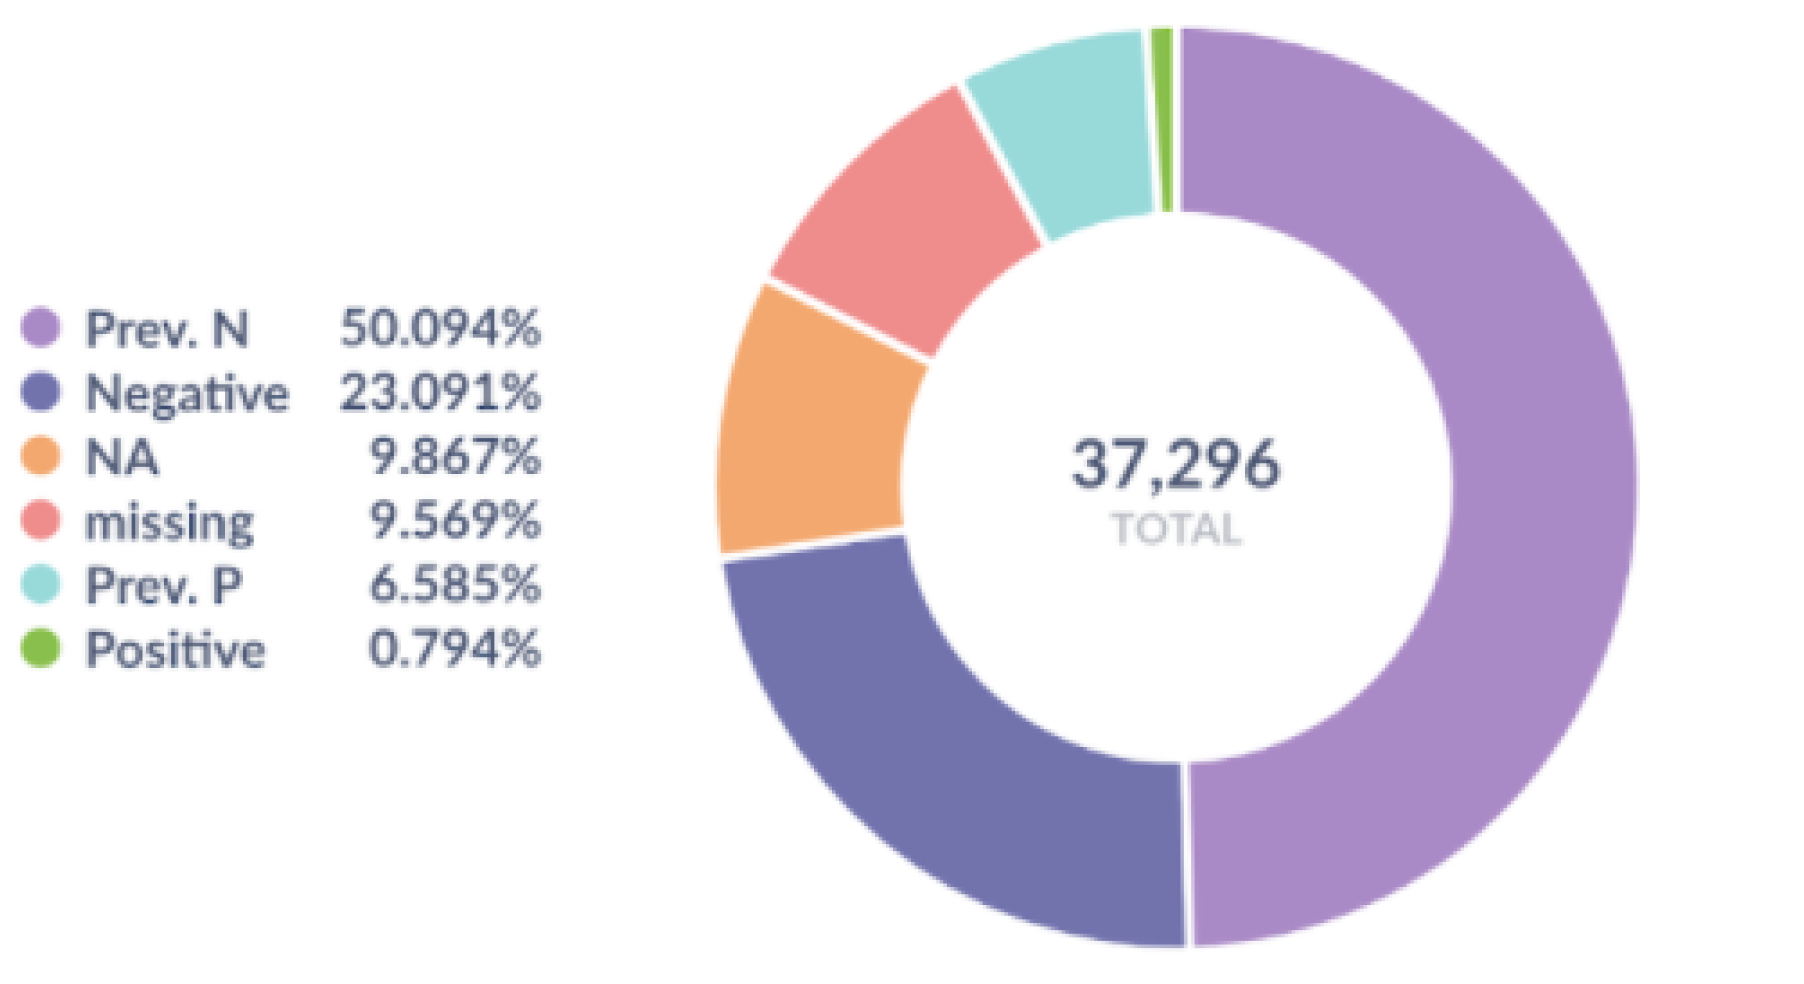
HIV Testing Results Disaggregated by Facility and Community Access Point
Malaria Data Collection in Kenya
From August 2020-21, six scannable routine MOH registers with ScanForm were piloted in 93 facilities in Migori and Homa Bay counties to increase the availability, analysis and quality of malaria data.
Weekly malaria cases per 1,000 population, by OPD <5 and >5 registers
Malaria positivity rate automatically calculated from ScanForm-based OPD < 5 registers, by sub-county in Kenya
Trends of antenatal care (ANC) visits over time are easily monitored with scannable ANC registers in Kenya
37,061
Total number of visits
9
Records with invalid data
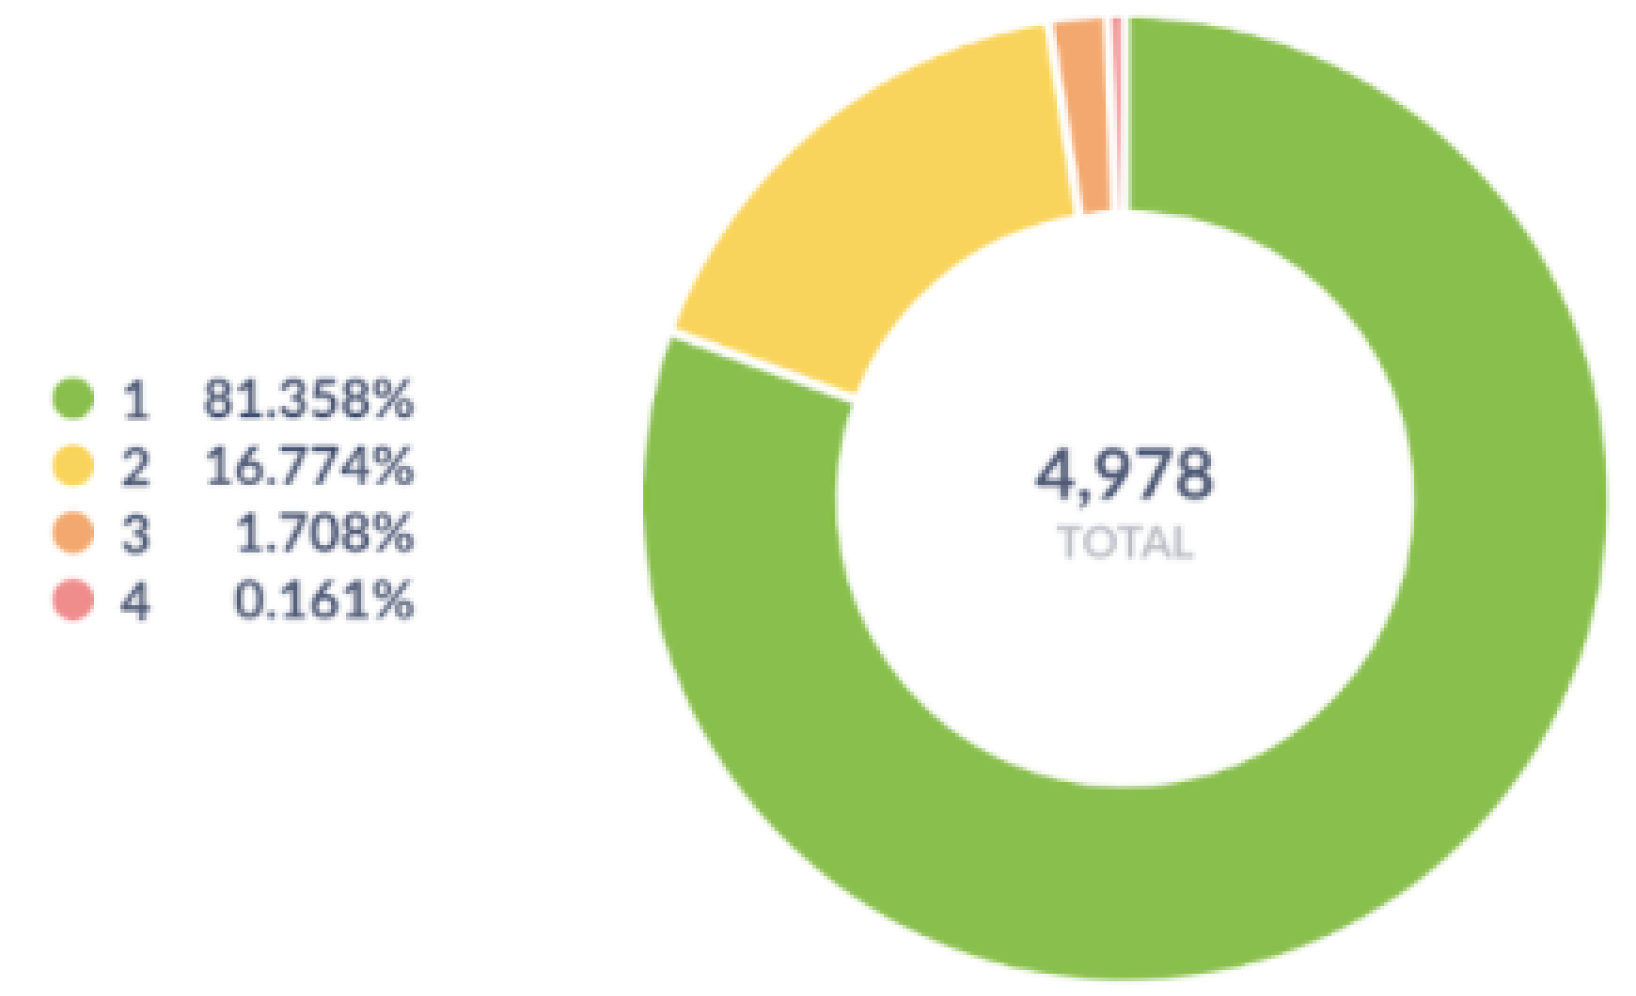
Distribution of HIV results and WHO stage from scannable ANC registers in Kenya
ANC HIV Results
ANC WHO Stage
In the MiMBa clinical trial, the distribution of malaria treatments from OPD > 5 registers are tracked with maternal health outcomes
Monitoring Clinical Trials
Tracking the spatio-temporal effects of Attractive Targeted Sugar Baits and Long Lasting Insecticidal Nets on reducing malaria infections.
Maps from scannable OPD <5 and OPD >5 registers show the geographic variation of malaria testing rate and proportion of malaria cases in Alego Usonga and Rarieda, Kenya
OPD<5: Malaria testing rate at Health Facility [%]
OPD>5: Malaria testing rate at Health Facility [%]
OPD<5: Proportion of Malaria Cases in all Outpatient cases [%]
OPD>5: Proportion of Malaria Cases in all Outpatient cases [%]
Population pyramid of malaria testing and treatment data from Kenya, by age group
Evaluating RTS,S - the malaria vaccine - with thousands of community health volunteers in Kenya
Community under-5 mortality surveillance of malaria in 8 endemic counties of Western Kenya
Influenza Vaccination Campaign in Kenya
With ScanForm, vaccination data was rapidly digitized to produce a list of defaulters, informing reminders for the next dose and track progress towards targets.